Elementary Detecting for Better Bug Hunting
Before we round up the usual suspects
With Sherlock Holmes, Arthur Conan Doyle popularized what was in his time a relatively new method of solving crimes. Holmes doesn’t jump to conclusions, round up the usual suspects, and wait for someone to crack and confess. He observes, gathers evidence, analyzes the data and, when he has reasoned his way through the problem, he presents his conclusions. He is scientific, analytical.
As programmers we would do well to remember Holmes’ method. All too often, we jump in and start debugging or optimizing code before gathering sufficient evidence. While jumping in may make us feel we are doing something, it is unfortunate, given that we have at our disposal a tool kit that enables us to easily gather and analyze data we need to pinpoint likely sources of a problem and focus our efforts.
Take for example a system that has become sluggish since the introduction of a new component. Rather than diving in blindly, let’s start with basic detective work. This is particularly important with today’s complex embedded systems that integrate multiple, third-party components. Nothing is gained by pointing fingers at a new component without evidence. Nor do we gain anything by jumping in to debug code we’ve run for millions of hours without issue until we eliminate the new component as the source of the sluggishness.
What the microkernel knows
Fortunately, if our system is running on the QNX® Neutrino® RTOS we can count on the microkernel, which in its instrumented variant is an almost ideal informant: it knows about pretty-well everything of importance happening in the system, it readily shares what it knows, and it requires neither bribes not coercion to do so.
For those unfamiliar with microkernels, two characteristics that differentiate them from monolithic kernels such as Linux are important to highlight here:
- Microkernels are minimalist
File systems, device drivers, networking and multimedia stacks, etc. are outside the kernel space, in user space. This architecture provides spatial isolation, protecting the kernel from other components, and these components from each other.
- Microkernels isolate components
With spatial isolation, microkernels rely heavily on interprocess communication (IPC). A disadvantage of IPCs is that they add some processing overhead. This disadvantage is more than overcome by the benefit it provides—reliability—a failed component won’t take down the system.
For more information about microkernel OSs, see the Ultimate Guide to Real-time Operating Systems (RTOS).
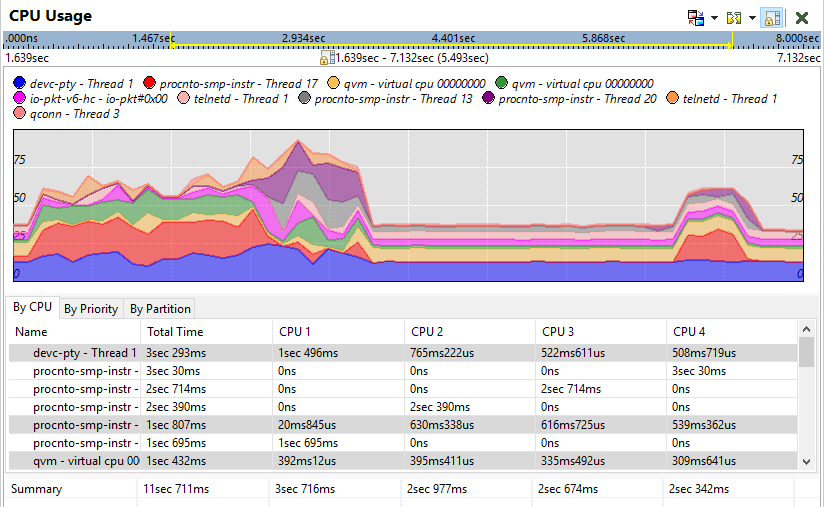
Figure 1 – CPU usage shown in the QNX Momentics IDE System Profiler
A further advantage of our microkernel is that, as we noted, it knows a great deal that applications don’t usually know. It knows about the creation of processes and threads, thread scheduling and state changes, IPC, and interrupts. All we need to do to learn what the microkernel knows is turn on trace logging.
Using trace logging to gather evidence
Just as Holmes might do when priming an informant, we’ll get the information we need more quickly if we provide the microkernel with some guidance. Too much data is almost as useless as no data. So, here we do need to jump in and make some educated guesses about what might be causing our system’s sluggishness. We set filters which tell the kernel what we’re not interested in knowing—at least until we’ve eliminated more likely suspects.
For example, if we strongly believe that some IPCs are responsible for our system’s woes, we can instruct the kernel to log only IPCs. Or, inversely, if we think that it just can’t be an IPC, we can do the opposite and log everything except IPCs. Or any combination we choose. In short, we send our informant to work with clear instructions about what information we consider relevant, then modify these instructions until we have an explanation.
Regardless of the filters we apply to our trace logging, we have three methods available to us to start and manage our trace logging. We can use the tracelogger utility from the command line, the QNX Momentics IDE, or we can call the TraceEvent() function from our own code.
Gathering additional evidence
One thing the microkernel can’t know about is what exactly a thread is doing when it is just performing some calculations. The reason for this gap in our informant’s knowledge is simple: until it completes its work or is interrupted, a thread doing calculations isn’t interacting with anyone, not even the kernel. It’s in a windowless room, thinking, scheming. However, because it’s our system, we can define our own trace events then use calls to functions in our API such as trace_func_enter() to insert them into our threads. When we turn on kernel tracing, the kernel will log these trace events as it does its own, and we’ll know what that thread is up to, even when it seems no one is watching.
Analyzing the evidence
Now that we have data, we can make informed hypotheses about what the code might be doing and why our system is having issues. With our IDE’s System Profiler we can put our traces under the magnifying glass and examine our three prime suspects:
- CPU cycles
Is a thread in our new application’s process slow because it consumes a lot of CPU cycles? Or is it another thread consuming more CPU cycles than expected?
- Dependencies
Does our application depend on another, perhaps very slow, process? If this is the case, our System Profiler will show it clearly.
- Bottlenecks
Is another process’s actions sometimes blocking our thread, so that it spends too much time waiting, missing important deadlines?
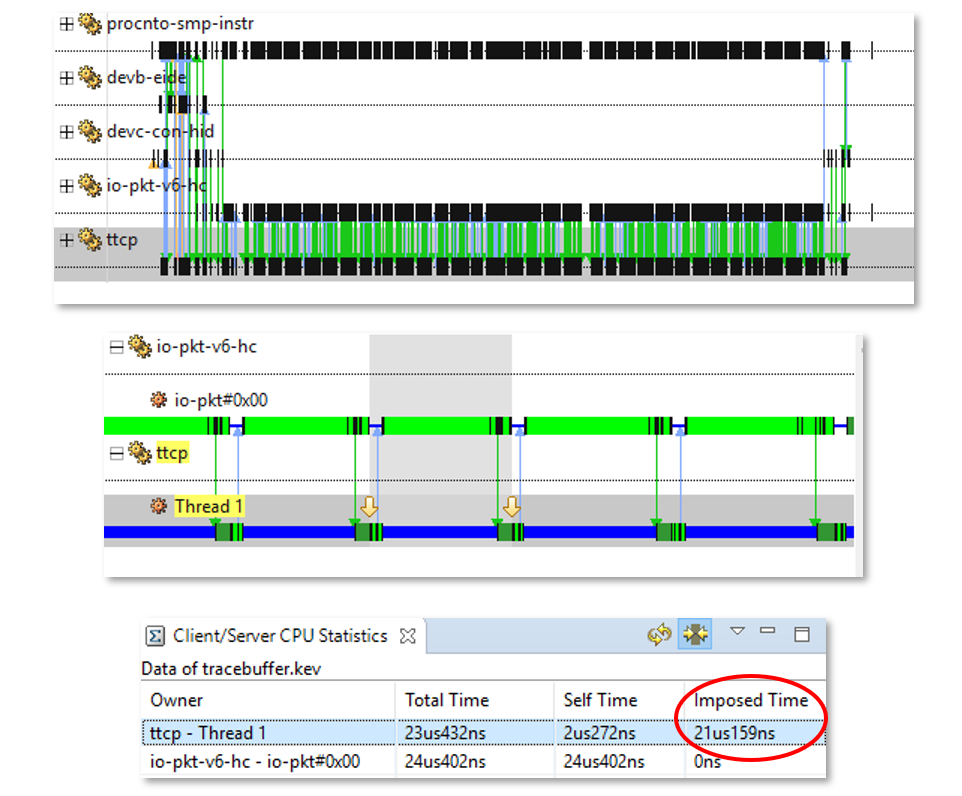
Figure 2 – A CPU timeline shown in the QNX Momentics IDE System Profiler
The lovely CPU timeline shown above and other System Profiler displays of data our kernel gathers allow us to quickly visualize what our system has been doing, and pinpoint where we need to investigate further. We likely haven’t looked at a line of code yet, but we now know enough to know where we need to look more closely to unmask the perpetrator.
If you’d like to dive deeper into kernel tracing and learn what the QNX Momentics IDE can show you about your system, have a look at my recent webinar: “Using Kernel Event Tracing to Uncover Performance Issues”.
QNX Neutrino RTOS – proven reliability, performance, security
Thousands of companies deploy and trust QNX real-time technology to ensure the best combination of performance, security and reliability in the world’s most safety-critical and mission-critical systems. At the core of this offering is the QNX® Neutrino® RTOS, a full-featured and robust microkernel RTOS designed to enable the next-generation of products for aerospace & defense, automotive, commercial vehicles, heavy machinery, industrial controls, medical devices, rail and robotics and automation. With the QNX RTOS, embedded systems designers can create compelling, safe, and secure devices built on a highly reliable RTOS serving as the foundation that helps guard against system malfunctions, malware and security breaches.
Learn more in the blog post How to Choose the Right OS for Your Embedded System: 10 Criteria for Success or visit the BlackBerry QNX website to explore the Ultimate Guide to RTOS.